The recipe for creating a piece of content that will be a big hit with users is not always obvious. Sometimes you’ll create a fantastic piece that you’re sure will do well, but it turns out to be a total flop.
While you can make an educated guess at the formula for successful content for your particular audience, the only way to know for sure is to actually measure the amount and impact of content engagement and user interaction you achieve with each piece of content. Once you have some actual figures to work with, you can keep tweaking and testing until you find a winning formula.
But how on earth do you go about measuring the value of user interactions? It’s notoriously difficult to measure the success of content marketing. Not because there’s nothing to measure (there are in fact dozens of valuable metrics you can track) but rather because the user journey, from consuming an initial piece of content through to making a sale or conversion, is rarely linear.
Once you introduce content into your marketing mix, your funnel becomes more complicated and a lot harder to figure out. Maybe someone reads content published by you, remembers your brand name, and so decides to buy your product when they see it in a physical store. Maybe another person is an avid reader of your blog content every week, but it’s a year or more before you convert them into a paying customer. How do you even begin to unpack all this and figure out exactly what impact your content marketing is having?
How to Measure and Track Engagement with Content
The first step is to decide what to measure. As previously mentioned, there are many metrics you could choose to concentrate on. The metrics or KPIs you choose depend on your business goals and what exactly you want to achieve from content marketing.
Beware of tracking “vanity” metrics that have little relationship to your goals. For example, it may look impressive to your superiors if your Facebook likes are increasing, but is that actually translating into increased sales and conversions? How do you know that more followers on social media is a result of your content marketing efforts? And are those users actually interacting with your brand and ultimately generating revenue?
Some metrics are also too general to be of much use. For example, the average number of pages each user views during a session on your site is an easy metric to track, but it only makes a correlative argument on whether they’re getting value out of your content. Users may be clicking around on multiple pages because they’re not finding what they need.
Any content analytics platform will give you a wide selection of metrics to track, but it’s up to you to decide which ones are important.
The metrics you track may also depend on where you publish your content. For example, you probably won’t be tracking exactly the same metrics for a blog post you publish on your own site as you do for a social media post.
It’s important to think carefully about each metric you choose to measure and what exactly it means. Misinterpreting web analytics when trying to measure content effectiveness is a frequent issue.
For example, common advice is that high bounce rate = bad user experience, and so you should aim to make your bounce rate as low as possible. In practice, this is only the case in certain situations. If a user is getting the information they need immediately, you’re delivering a great user experience. Conversely, a low bounce rate doesn’t mean that your user engagement is high if those users are wandering your website, getting increasingly frustrated because they can’t find what they want.
Metrics for Measuring User Interaction and Engagement
That being said, there are a few “popular” metrics that many businesses find work best for measuring the effectiveness of their content.
Some of the most common metrics B2B companies use to track content performance include website traffic, social media analytics, and conversions. But two of the top three spots are taken by engagement metrics, such as opens, clicks, downloads in email and time spent, bounce rate, and form completions on the brand website.
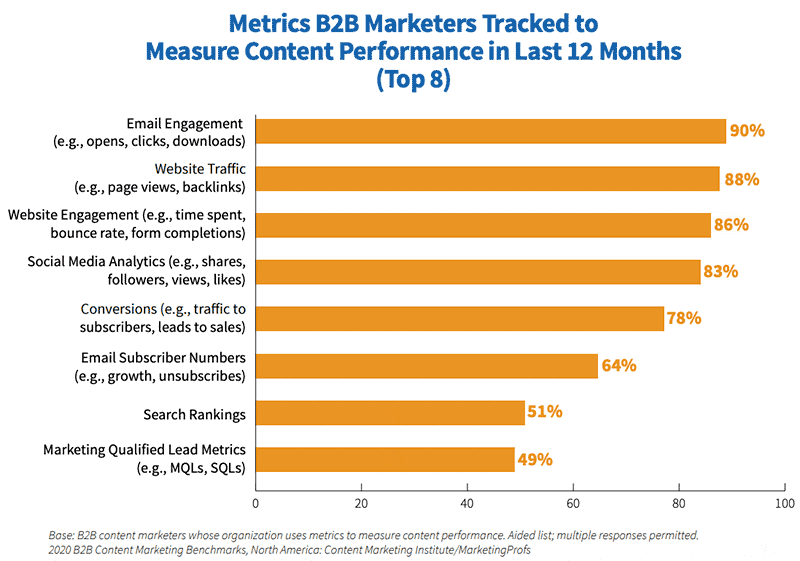
It’s clear that engagement is one of the most important aspects of judging content performance. Social media shares and website traffic are also important things to measure, but only engagement metrics give you real insight into how users are interacting with your content.
The top engagement metrics to understand user interaction include:
- Engaged time/attention minutes – Available in some analytics platforms, this metric shows you the time that a user is actively engaged with a page. In other words, the page must be active, and the user must be carrying out actions such as scrolling or clicking for it to count. Session duration is a more common metric to measure, but it can be misleading as if the user leaves the browser window open but isn’t actively interacting with the content, it may still be interpreted as a high level of engagement.
- Clicks – If a user clicks a link in your content, they’re certainly interacting with it. Users often scan content looking for information rather than reading it thoroughly, so if they’re clicking a link, it means you’re providing something useful. Bonus points if they click a CTA!
- Downloads – Actively downloading a piece of content shows a greater user commitment than simply reading a web page. If they’ve signed up to your list in order to download the content, it means it’s even more valuable.
- Comments – Comments are often overlooked as a metric for measuring content effectiveness, but the value of user comments should not be underestimated. The comments section of your content gives you the opportunity to interact with your audience directly, and it can be a helpful place to glean information to help you produce future content.
- Interaction depth – This is a measure of how far a user has explored your side in a single session. If they’re following links in your posts to further content, this is a good sign that they’re finding your content useful and engaging.
- Frequency of visits – A user who keeps coming back for more content is a sure sign that you’re doing something right. If you publish content regularly and you’re looking to build a loyal audience, you want to aim for a high frequency.
- Social media shares and comments – Don’t confuse these metrics with the mostly meaningless “likes” of your brand page. If someone shares your content on social media, it means they resonate with what you have to say and they want to share it with their peers. Social media comments are just as valuable as blog comments for taking actionable insights and encouraging engagement.
How to Act on Analytics Insights
So now that you have this information, what do you do with it? By tracking engagement levels over time and across different content marketing campaigns and individual pieces of content, you can paint a better picture of what type of content resonates with your audience.
Choose the metrics that are most valuable to the goals of your business and content marketing campaigns and start tracking. You’ll soon have a set of benchmarks to compare each new piece of content with.
Do your users spend several minutes watching your video content on social media but never share or comment on your blog posts? Maybe video is a better match for your audience. Is your whitepaper not attracting the downloads you thought it would? You need to figure out why and perhaps offer a more attractive or interactive eBook next time.
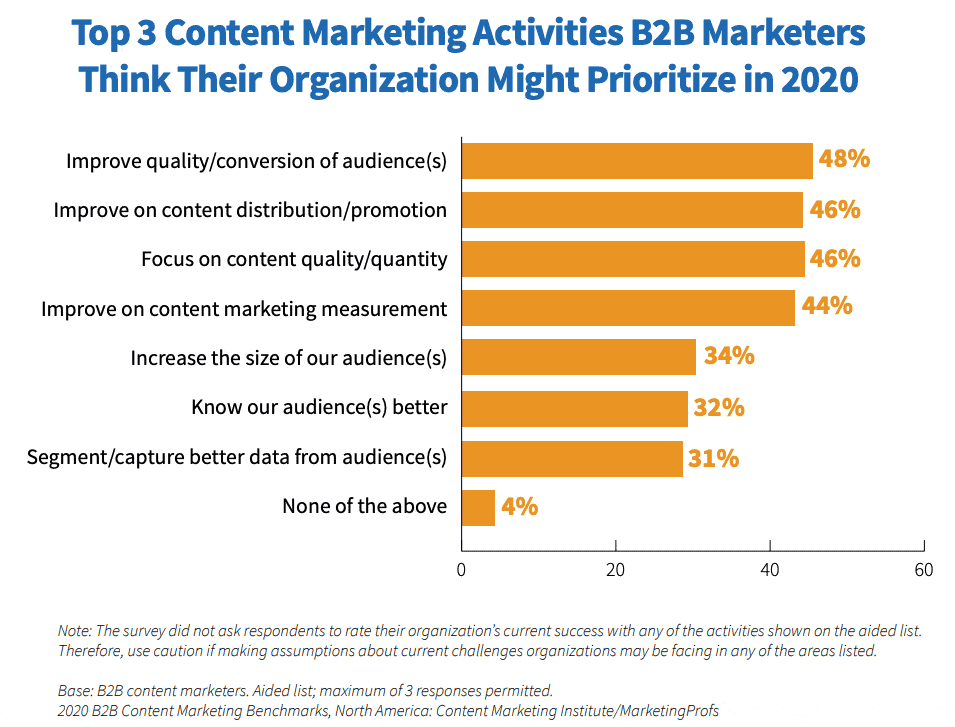
Forty-four percent of B2B marketers surveyed by the Content Marketing Institute said that their organization would be prioritizing the improvement of content marketing measurement in 2020.
Choosing an analytics platform like DivvyHQ designed specifically to measure the success of content rather than simply track web analytics can help you to interpret your results more accurately. It can also help you gather actionable insights that will help you to improve your content and grow your business. For an in-depth demo of our analytics capabilities, just say the word.