According to a Content Marketing Institute report, 81% of B2B content marketers analyze content performance. I know tracking and reporting on the performance of your content marketing efforts isn’t necessarily creative or sexy, but it’s critical.
Whether you are an in-house content team or an agency helping clients generate great content, content analytics is your guide for determining what’s working and what’s not. Analytics also informs your future strategy and planning efforts.
Content marketing reporting is often complex, with numerous types of metrics. Collecting and aggregating data across multiple channels is also a struggle.
If your team faces reporting challenges, standardization can help. You’ll find that collaborating with your analytics gurus to develop templates that inform stakeholders of trends, opportunities, and anomalies makes the process much smoother. Let’s dive into what templates are helpful and the features you need them to have.
Key Takeaways:
- Content marketing reporting is critical to understanding content performance.
- Producing understandable reports provides accountability to clients.
- Creating templates and automating analytics and reporting makes the process efficient.
- Generating five types of templates provides most content teams and stakeholders with the necessary information.
In This Article:
- Why You Need a Content Marketing Reporting Template
- Which Content Marketing Reporting Templates To Create
- Automated Content Marketing Reporting is Possible with DivvyHQ
Why You Need a Content Marketing Reporting Template
As an agency, your organization likely juggles many clients. The agency’s clients are important stakeholders. As such, you might need to inform all of them about content performance.
Agency content teams already face challenges meeting content production deadlines without adding the time-consuming reporting process into the mix. Maintaining high productivity and efficiency is necessary for pushing out the amount of high-quality content your audience craves.
Unfortunately, teams that measure content performance and produce reports for stakeholders find that the analytics and reporting process deflates productivity and efficiency. If your team gathers and aggregates data and creates reports manually, the process likely takes hours or even days.
Manual content marketing reporting is not sustainable or scalable. Automating the reporting process significantly reduces the time required to generate reports, but you need confidence in the information automated reports include.
To optimize the process and take advantage of automation, you’ll need the right technology tools, such as those in content marketing software. Using Divvy’s platform allows you to generate templates for fast reporting, standardizing the format and the type of information your reports include.
I recommend creating a few templates that provide focused information to help you determine your content marketing return on investment. Targeting your metrics makes understanding different aspects of your content marketing efforts easier. It’s also easier to circulate only the information stakeholders need.

Which Content Marketing Reporting Templates To Create
The templates you create should reflect your team’s reporting needs as well as those of your clients and other stakeholders. However, most agencies expect content marketing to:
- Increase website traffic
- Improve social media engagement
- Support the customer journey
- Convert users
- Build brand awareness and thought leadership
- Increase organic search engine rankings
You’ll need to determine metrics for measuring your content performance goals. Make sure you use key performance indicators that are readily understandable to anyone who needs access to the report, regardless of their content marketing acumen. Here are some ideas for assembling easy-to-comprehend content marketing reporting templates.
Traffic Reports
Website traffic is one of the primary metrics B2B companies use to measure content performance. It’s also a metric that is easy for any stakeholder to understand.

Source: Content Marketing Institute
Your template should include traffic quantity, growth, sources, and activity information. Most of these metrics are foundational to Google Analytics.
However, GA’s reports can be confusing. You’ll want to create an accessible report on traffic. The template should include:
- Total traffic for the month and month-over-month comparisons
- Traffic sources and trends (increases and decreases)
- Duration of sessions for users and bounce rate with a historical glance
You’ll also want to offer contextual analysis with each of these points. Are there reasons traffic increased or decreased? If a source’s referral rate goes up, why is that? It could be because you ran a campaign on social media or sent an email with a content offer.
When you sign on with Divvy, we create a customized analytics and content marketing reporting dashboard. We’ll set you up with the tools to generate automated traffic reports using the metrics you wish to include.
Topics and Format Success Reports
When building a content calendar for clients, you want to deliver variety while listening to users’ feedback. That feedback is in the data.
To learn what topics and formats their audience appreciates, create a template that includes:
- Most viewed content by topic and format
- Social media engagement based on topic and format
- Best topics and formats by conversions
Analyzing this data type will give you a better view of audience preferences. For example, you could discover that explainer videos on the features of their product have strong viewership, high engagement, and generate conversions/leads.
Measuring content topic and format performance also tells you when audience preferences shift, allowing you to pivot your strategy before engagement rates decline so much that getting them back up is a struggle.
Lead Generation and Conversion Reports
Another critical content marketing reporting template for agencies is a lead generation and conversion template. Your stakeholders are likely more interested in what content moves the lead and conversion needle.
To develop such a report, you’ll need to trace a buyer’s journey and interactions with the brand. Additionally, when a conversion occurs, you need to know why.
Your reporting template may include:
- Number and type of conversion (i.e., contact forms, landing pages, social media), which you can track through goals in Google Analytics and other sources
- Content that “assisted” in driving the conversion (entrance pages, previous page visits, ads, gated resources, or email campaigns)
- Sketch of the buyer’s journey and how it aligns with content consumption
Using funnel visuals within this type of content marketing reporting will help your clients connect the dots. They will learn about what content provides value to their audience and how they respond to it. This data can inform content planning for future campaigns.
Divvy’s analytics tools work great for these metrics, as the data comes from multiple channels. Using our platform removes the need to aggregate data manually, freeing you up to attend to creating awesome content.
Search Engine Optimization Reports
Organic ranking is critical in content marketing since most buyers start with a Google search. SEO is competitive, always changing, and a long-term strategy. It’s a foundational element to traffic, conversions, and engagement.
A good SEO report template should include:
- Rankings for all keywords and month-over-month changes in chart form
- Keyword stats (volume and competition)
- Keyword mapping (the URL that displays on the search engine for that keyword search)
When changes in ranking occur — whether positive or negative — you’ll want to understand why, and so will your clients. You may see bumps in ranking after an update to a post or because it had more social media clicks. Conversely, you may slip in the rankings if a keyword becomes more competitive.
Social Media Reports
Another critical aspect of content marketing reporting is social media activity. Social media platforms are typically the channels with the highest audience engagement and shares.
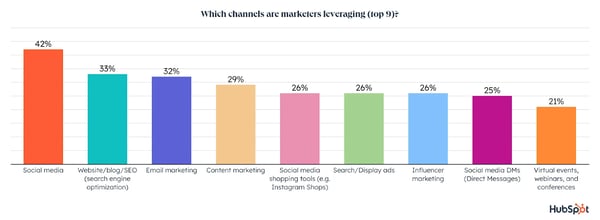
Source: Hubspot
The more engagement you have, the more likely you will receive more traffic and conversions. However, staying on top of social media content performance is challenging without using reporting templates and automation because of the sheer volume of content you likely distribute on the platforms.
Reporting for each profile on social media should include:
- Monthly posts, followers, engagements, and clicks, with month-over-month comparisons
- Top posts for each month
- Follower make-up
- Website visits from social posts
- Conversions from social referral traffic
Again, you’ll want to supplement the data points with analysis and granularity. Understanding why you saw more or less engagement is critical to planning your next steps.
Automated Content Marketing Reporting Is Possible with DivvyHQ
Divvy’s content analytics module is powerful, allowing you to streamline and automate analysis to determine if you’re hitting your client’s content strategy goals. Our software offers pre-configured, customized dashboards that combine multiple data streams from more than 100 unique sources into holistic views.
Our tools make it easy to generate any reporting template you need. Within minutes, you can create a report that provides actionable insights.
We make the process easy. Hey, content marketing is hard enough; the way you measure it shouldn’t be. You’ll find this functionality and so much more with DivvyHQ. Request a demo today to see how we can help with your content marketing reporting.